Simulation Viewer Utility
Visualize 2D/3D simulation data, create cross-sections, and compare multiple datasets on an infinite whiteboard.
Windows 10/11 • 64-bit • Portable application
Drag simulation files onto the canvas to start analyzing.
What file formats are supported?
Uses Apache ECharts for ultra-fast, interactive visual rendering.
Application
Workflow
A streamlined process to visualize and analyze your simulation data from start to finish.
Data Input
Drag and drop supported files (.cht, .fgd, .fits) to begin. Data is automatically parsed and listed in the workspace sidebar.
Workspace Layout
Position heatmaps, 3D surfaces, and plots on the infinite whiteboard. Elements can be resized and rearranged to build custom comparison views.
Analysis Tools
Generate 1D cross-sections and polar views with interactive controls. Overlay multiple datasets to compare results across different simulation runs.
Export Results
Save workspace snapshots as high-resolution images for publication, or export the entire session to JSON for future analysis.
Professional Analysis Tools
Providing high-precision data visualization and comparative analysis in one workspace.
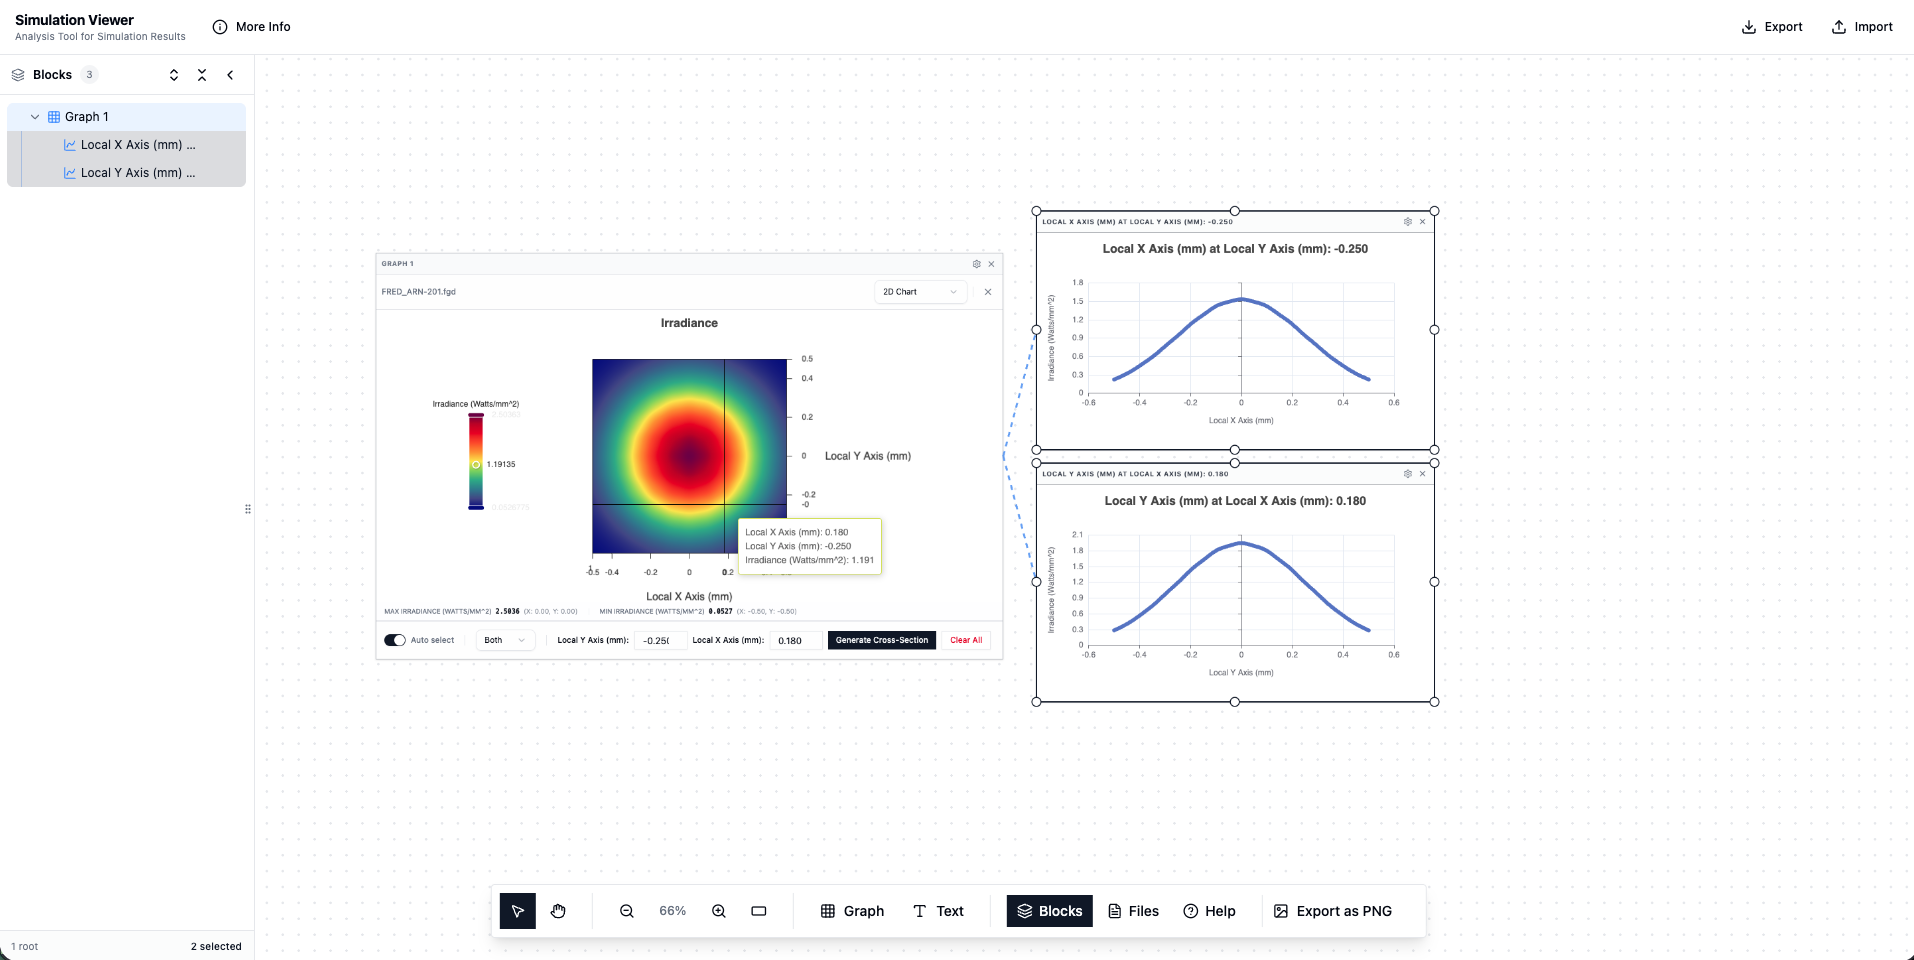
Instant 1D Cross-Sections
Transform static heatmaps into dynamic discovery tools. Click any point to generate precise line plots along X or Y axes.
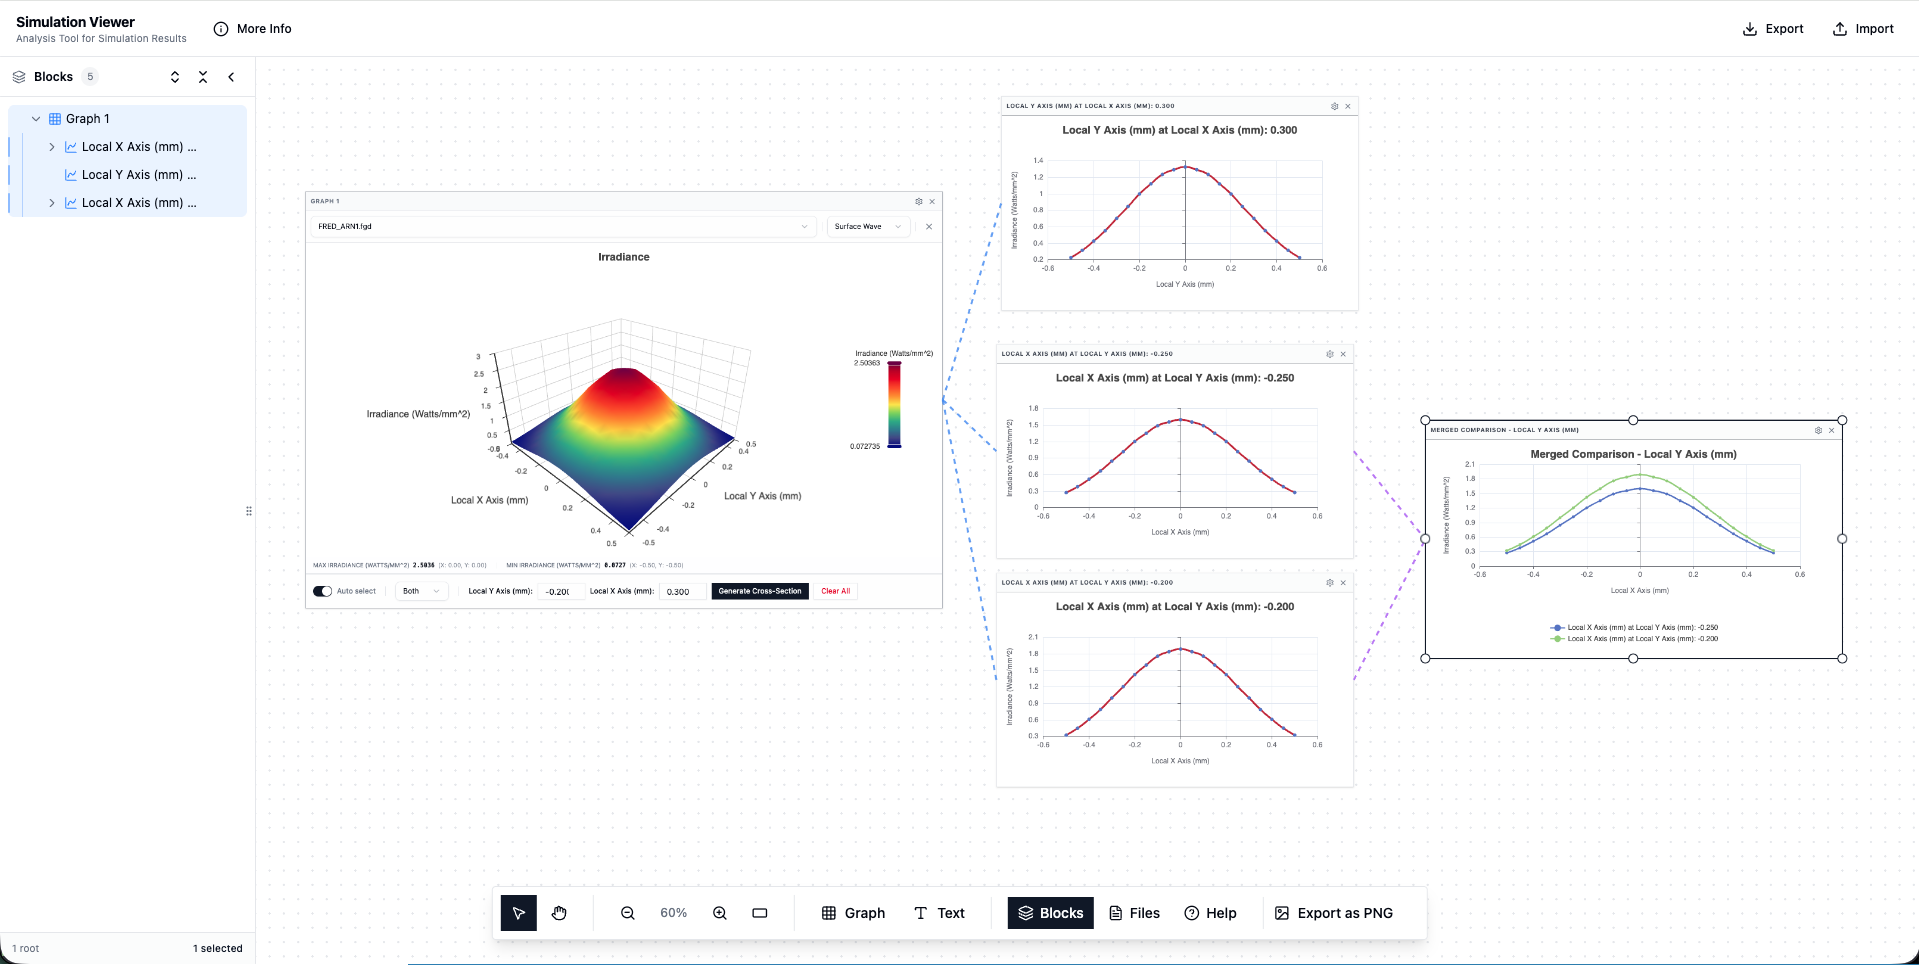
Unified Dataset Comparison
Stop switching between tabs. Merge multiple simulation results into a single synchronized view. Overlapping plots allow for immediate identification of variance and optimization trends.
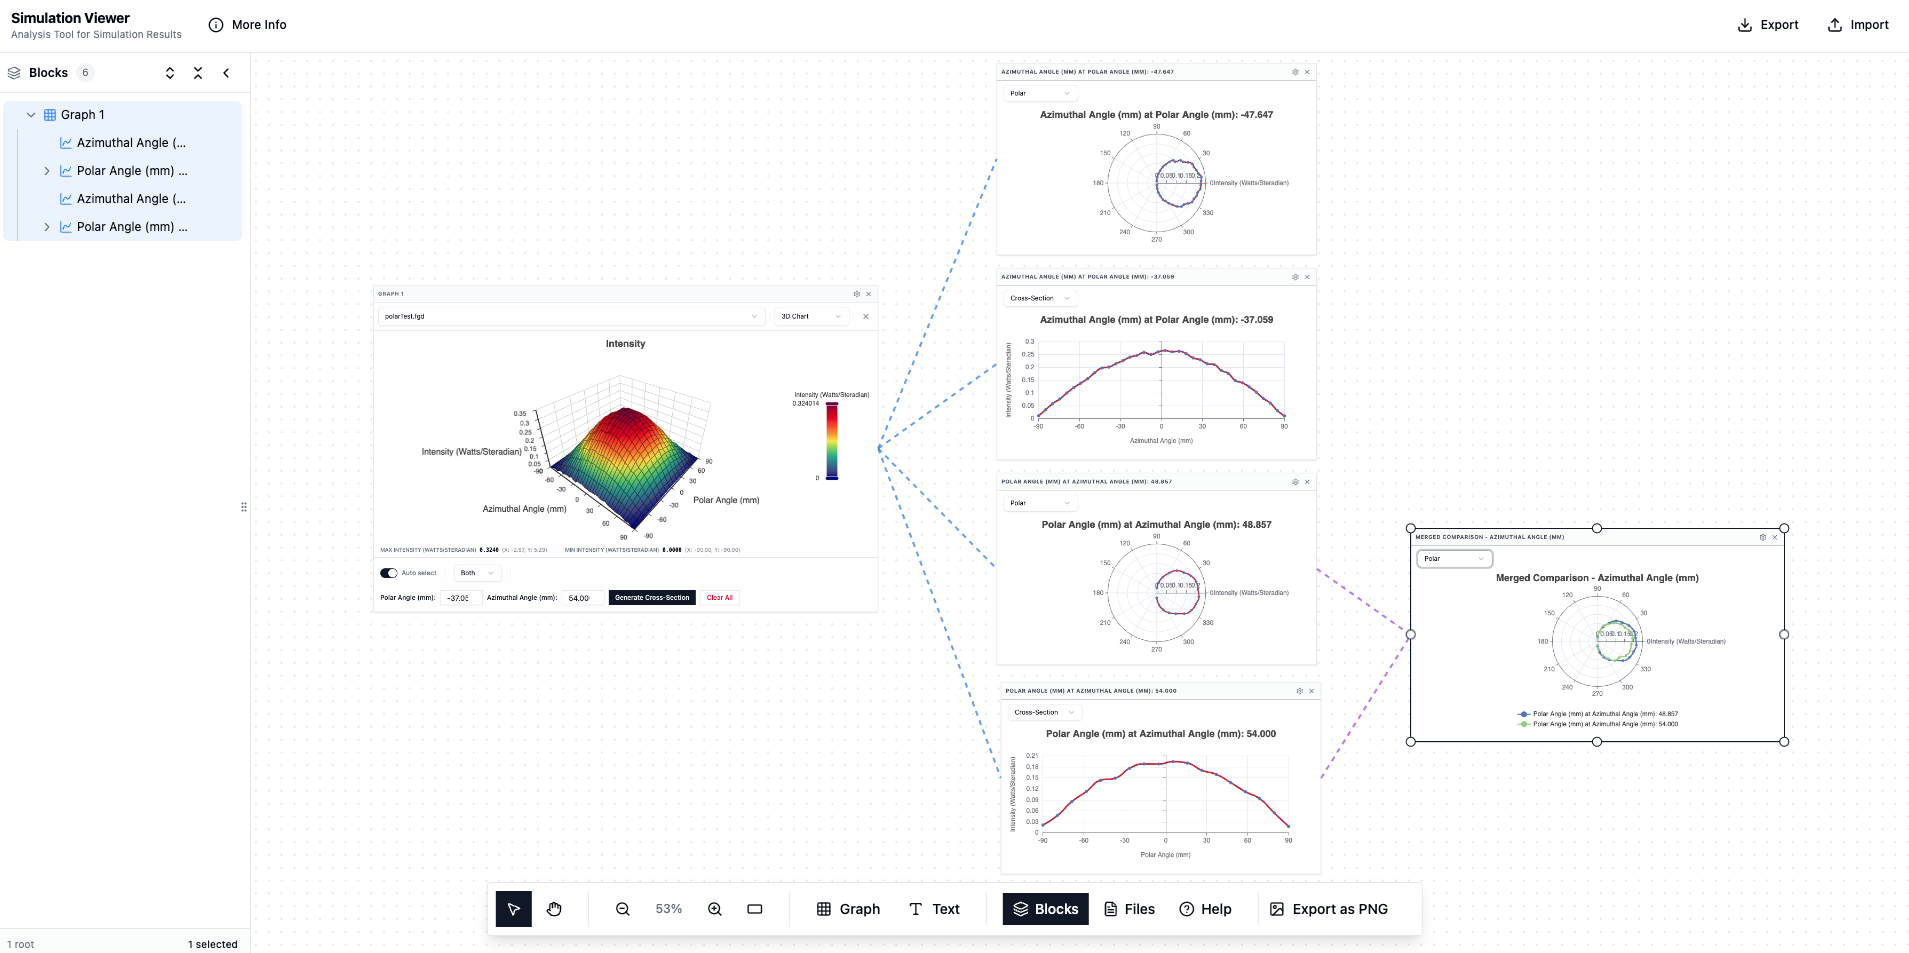
Advanced Polar Mapping
Perfect for viewing angular distribution data. Switch your analysis to the Polar view to visualize angular distributions more intuitively. Our engine handles the coordinate transformation natively, keeping your workflow fluid.
Technical Specifications
A standalone desktop environment designed for low-latency data interaction and consistent workflow management.
Spatial Organization
Infinite Canvas Layout
Place heatmaps, 3D surfaces, and polar plots on an unconstrained whiteboard. Arrange and resize elements to build the exact comparison view required for your analysis.
Local Execution
Offline Standalone App
A self-contained desktop environment that requires no internet connection or external server processing. Data is parsed and rendered entirely on your local hardware.
System Performance
High-Density Rendering
Built on Apache ECharts for low-latency interactivity even with high-resolution datasets.
Data Persistence
JSON Workspace Files
Export the complete state of your workspace to portable JSON files. This allows for reopening exact configurations, including chart positions and cross-section overlays.
Frequently Asked Questions
-
.cht (Photon Design), .fgd (Photon Engineering field data), and .fits (FITS standard).
-
Windows 10/11 (64-bit). We recommend 8GB RAM for larger datasets. A dedicated GPU improves 3D rendering performance but is not required.
-
Click anywhere on a 2D heatmap to create a 1D slice at that position. The cross-section appears as a separate line chart. You can create multiple slices and overlay them.
-
Charts export as PNG images. Workspace layouts (including chart positions and settings) save to JSON files.
-
No. The application runs entirely locally. No data is uploaded anywhere.
-
The application is designed for large simulation datasets. Performance depends on your system's RAM and GPU. GPU-accelerated rendering helps with complex 3D surfaces.
-
Simulation Viewer uses Apache ECharts to render fast, interactive charts and plots.
-
Yes. Save your canvas layout, including all charts and their positions, to a JSON workspace file. Reopen it anytime to continue where you left off.
Have other questions? Email support@technixbycbs.com or use our contact us
Ready to Analyze Faster?
Download Simulation Viewer Utility for Windows 10/11. Portable application, no installation required. Start visualizing your data in seconds.
v1.0 • Portable executable
Questions or feedback? Email us at support@technixbycbs.com or via our contact us